Air Liquide Full Year 2017 Results
Air Liquide Full Year 2017 Results
Full Year 2017 Results A Step Change in Sales with Improved Performance Airgas Synergies Ahead of Plan Paris, 15 February 2018
Agenda 1. Highlights 2. 2017 performance 3. 2018 priorities and outlook 2 15 February 2018 Full Year 2017 Results The world leader in gases, technologies and services for Industry and Health
Highlights Benoît Potier Chairman & Chief Executive Officer 15 February 2018 Full Year 2017 Results The world leader in gases, technologies and services for Industry and Health 3
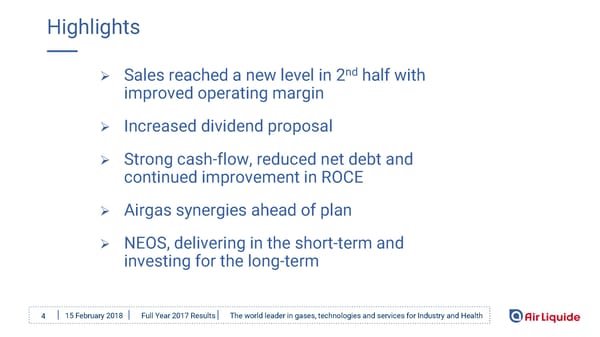
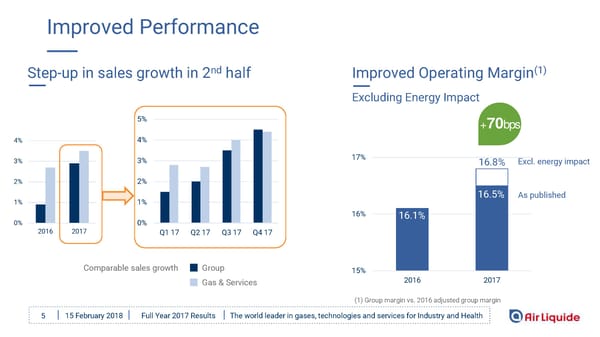
Highlights Sales reached a new level in 2nd half with improved operating margin Increased dividend proposal Strong cash-flow, reduced net debt and continued improvement in ROCE Airgas synergies ahead of plan NEOS, delivering in the short-term and investing for the long-term 4 15 February 2018 Full Year 2017 Results The world leader in gases, technologies and services for Industry and Health
Improved Performance Step-up in sales growth in 2nd half Improved Operating Margin(1) Excluding Energy Impact 5% +70bps 4% 4% 3% 3% 17% 16.8% Excl. energy impact 2% 2% 16.5% As published 1% 1% 16% 16.1% 0% 0% 2016 2017 Q1 17 Q2 17 Q3 17 Q4 17 Comparable sales growth Group 15% Gas & Services 2016 2017 (1) Group margin vs. 2016 adjusted group margin 5 15 February 2018 Full Year 2017 Results The world leader in gases, technologies and services for Industry and Health
Increased Dividend Proposal Net Profit Dividend Growth: +12% (2) €2.65 €2.2bn 2,8 20 yrs 2,4 CAGR As published Dividend(1) 2,0 +9.5% in € per share 1,6 1,2 +19.3% +10% 0,8 0,4 0,0 As published Excluding non-cash 1997 1999 2001 2003 2005 2007 2009 2011 2013 2015 2017 non-recurring items & taxes (1) Historical data adjusted for attribution of free shares and for a factor 0.974 reflecting the value of the rights of the capital increase completed in October 2016 (2) Subject to approval at the combined shareholders’ meeting scheduled for 16 May 2018 15 February 2018 Full Year 2017 Results The world leader in gases, technologies and services for Industry and Health 6
Improved Cash Flow and Balance Sheet Reduced Net Debt and Gearing Continued Improvement in ROCE Excl. 2017 positive impact on net profit of non-cash <25> 151% 160% one-off items 140% 10.3% >10% <20> 120% 10% 90% 80% 100% (1) <15> 80% Gearing 7.7% <13.4> 80% comfort 8% 7.4% 60% 57% 60% range <10> 40% 6.9% 20% 6% <5> 0% Dec. 15 Dec. 16 June 17 Dec. 17 2021/22 Dec. 15 June 16 Dec. 16 Dec. 17 adjusted NEOS In €bn Airgas Airgas objective acquisition Net debt Gearing acquisition (1) As published 2017 ROCE = 8.2% 15 February 2018 Full Year 2017 Results The world leader in gases, technologies and services for Industry and Health 7
Airgas Synergies Ahead of Plan Synergies US$40m ahead of initial 2017 target Cost synergies delivered faster US$ Cumulated synergies end of 2019: 215m in excess of US$300m pace and higher level of cost synergies Cumulated Synergies Dec. 2017 revenues synergies ramping Leveraging the Airgas model Expansion of customer centric management in the Group 8 15 February 2018 Full Year 2017 Results The world leader in gases, technologies and services for Industry and Health
Delivering in the Short-Term… Mega trends Energy & Healthcare Digital Group Smart Biogas Innovative Operations Strategic (SIO) asset review Voice of Energy the efficiency Customer (VoC) New organization E-health E-business websites 15 February 2018 Full Year 2017 Results 9
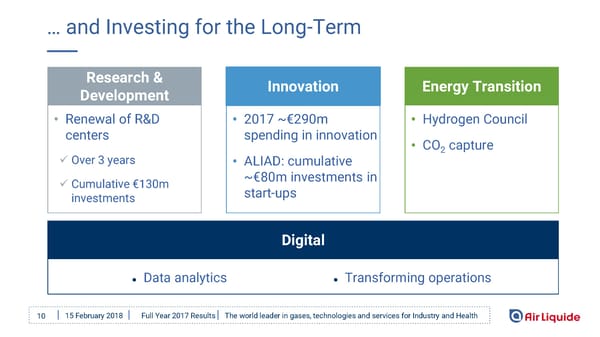
… and Investing for the Long-Term Research & Innovation Energy Transition Development • Renewal of R&D • 2017 ~€290m • Hydrogen Council centers spending in innovation • CO capture Over 3 years • ALIAD: cumulative 2 ~€80m investments in Cumulative €130m start-ups investments Digital ● Data analytics ● Transforming operations 10 15 February 2018 Full Year 2017 Results The world leader in gases, technologies and services for Industry and Health
2017 Performance Fabienne Lecorvaisier Executive Vice President & Chief Financial Officer 15 February 2018 Full Year 2017 Results The world leader in gases, technologies and services for Industry and Health 11
Sales Growth Accelerating in G&S, E&C Stabilizing (1) Refer to appendix for definitions 12 15 February 2018 Full Year 2017 Results The world leader in gases, technologies and services for Industry and Health
Better Economic Environment Step-up in IP growth, expected to stabilize in 2018 Negative FX Impact(1) Industrial Production Year on Year in % (3-month rolling average) -1.6% -5.4% FY 2017 Q4 2017 Low Energy impact in Q4(1) +1.5% +0.5% FY 2017 Q4 2017 (1) On Group sales, based on 2016 adjusted sales 13 15 February 2018 Full Year 2017 Results The world leader in gases, technologies and services for Industry and Health
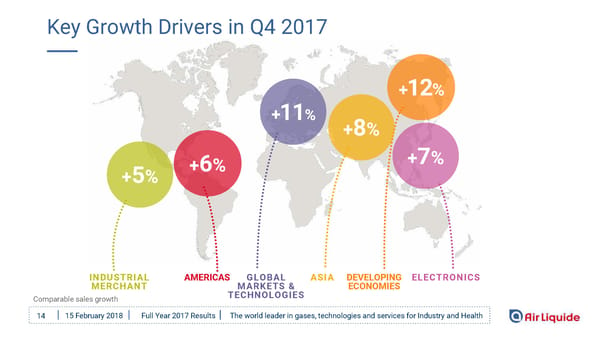
Key Growth Drivers in Q4 2017 +12% +11% +8% +5% +6% +7% INDUSTRIAL AMERICAS GLOBAL ASIA DEVELOPING ELECTRONICS MERCHANT MARKETS & ECONOMIES Comparable sales growth TECHNOLOGIES 15 February 2018 Full Year 2017 Results The world leader in gases, technologies and services for Industry and Health 14
Base Business Contribution Firming-Up G&S Quarterly Growth Analysis +14% +31% +29% 19 START-UPS in FY17 Strongest base business since Q1 2014 (1) Comparable growth based on 2016 adjusted sales 15 February 2018 Full Year 2017 Results The world leader in gases, technologies and services for Industry and Health 15
Q4 -Accelerating Americas,Sustained IM in Europe +31% FY as published AMERICAS EUROPE FY 2017 FY 2017 €8,150m €6,776m G&S Comparable Sales Growth Excluding the impact of the one–off in Q4 2016 Strong IM and LI in Americas Improved underlying activity • LI: rebounding after hurricanes • LI: solid H2 demand; high comparison effect • IM: growth accelerating to >+6% • IM: sustained growth above +3%; bulk and • EL: dynamic Advanced Materials, low E&I cylinder volumes up • StrongHCin Latin America and Canada • Solid HC, still low contribution from acquisitions 16 15 February 2018 Full Year 2017 Results The world leader in gases, technologies and services for Industry and Health
Q4 -Very Strong Asiaand Middle-East ASIA-PACIFIC MIDDLE-EAST FY 2017 & AFRICA FY 2017 €4,081m €635m G&S Comparable Sales Growth Very good momentum in all WBLs High growth in all WBLs • LI: ramp-ups in China, high volumes • LI: high loading at Yanbu (KSA); major • IM: China driving growth with strong volumes start-up in South Africa end December and pricing; low equipment sales in Japan • IM: volumes improvement throughout • EL: accelerated growth, strong Carrier Gases, the region dynamic Advanced Materials, high E&I • Strong HC in South Africa 17 15 February 2018 Full Year 2017 Results The world leader in gases, technologies and services for Industry and Health
Q4 - IM Driving Growth, LI Outlook Positive +22% FY as published INDUSTRIAL LARGE MERCHANT INDUSTRIES FY 2017 FY 2017 €9,261m €5,336m G&S Comparable Sales Growth Continued increase in IM High volumes offset by Q4 2016 one-off • Accelerating in North America • Highair gases and H2 volumes • Very strong China, dynamic in Americas developing economies • Ramp-upsin China • All end-markets up • Major start-up in South Africa • Firming pricing, +1.7% • Europe: sales slightly up excl. exceptionals 15 February 2018 Full Year 2017 Results The world leader in gases, technologies and services for Industry and Health 18
Q4 - Very Dynamic HC and EL +9% FY as published HEALTHCARE ELECTRONICS FY 2017 FY 2017 €3,401m €1,644m G&S Comparable Sales Growth Steady activity, high contribution from acquisitions Double-digit growth in Asia • Very strong Americas • Ramp-upsin Carrier Gases • Dynamic development in Asia • New contracts in Asia, high E&I • High growth in Medical Gases • Strong Advanced Materials 19 15 February 2018 Full Year 2017 Results The world leader in gases, technologies and services for Industry and Health
Low E&C, Developing GMT (1) Sales and Order intake –in €m 500 500 E&C GMT 400 400 300 300 200 200 100 100 0 0 H1-15 H2-15 H1-16 H2-16 H1-17 H2-17 H1-15 H2-15 H1-16 H2-16 H1-17 H2-17 Sales Order intake Sales Order intake (1) Group and third-party order intake 20 15 February 2018 Full Year 2017 Results The world leader in gases, technologies and services for Industry and Health
Improved OIR Margin in line with NEOS 15 February 2018 Full Year 2017 Results The world leader in gases, technologies and services for Industry and Health 21
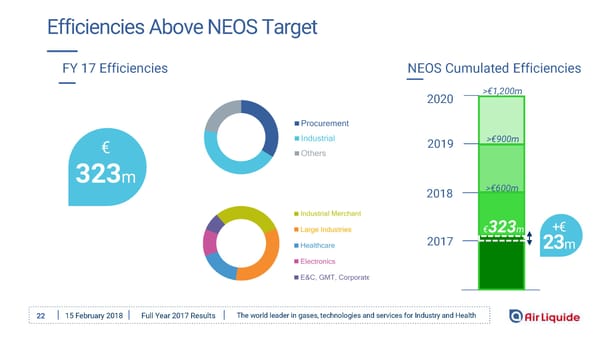
Efficiencies Above NEOS Target FY 17 Efficiencies NEOS Cumulated Efficiencies 2020 >€1,200m 2019 >€900m € 323m 2018 >€600m €323m +€ 2017 23m 15 February 2018 Full Year 2017 Results The world leader in gases, technologies and services for Industry and Health 22
2017 Airgas Cumulated Synergies Ahead of Plan Initial (1) Update US$ target >300m >300m 215m 2019 270m Costs ~US$190m 2018 >235m 215m Revenue ~US$25m +US$ 2017 >175m 40m • 2017 costs synergies US$40m above initial target Higher procurement synergies Cylinder management integration 2016 45m 45m faster than expected (1) Defined in 2016 In US$ In US$ 15 February 2018 Full Year 2017 Results The world leader in gases, technologies and services for Industry and Health 23
Positive Non-cash Exceptionals, Net Profit Recurring +10% Recurring FY 2017 = FY 2017 excluding non-cash one-off items FY 2016 Earnings Per Share adjusted for free share attribution of October 2, 2017. 15 February 2018 Full Year 2017 Results The world leader in gases, technologies and services for Industry and Health 24
2017 Non-Cash Exceptional Items and Taxes Extended strategic review of assets portfolio 2017 impact of U.S. tax reform Tax rate adjustment on deferred taxes Repatriation tax Impact of U.S. tax reform onwards 2018: US$50m to US$70m tax reduction 25 15 February 2018 Full Year 2017 Results The world leader in gases, technologies and services for Industry and Health
Significant Debt Reduction GEARING CASH FLOW 90% +15% GEARING 80% Net Debt Net Debt 31 Dec. 2016 31 Dec. 2017 (1) Including acquisitions, transactions with minority shareholders, net of divestitures. (2) Including share purchases and capital increases. 15 February 2018 Full Year 2017 Results The world leader in gases, technologies and services for Industry and Health 26
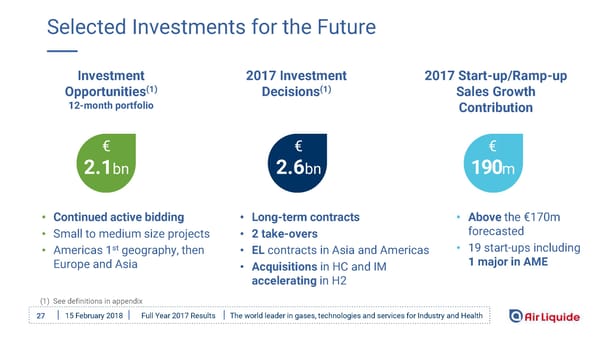
Selected Investments for the Future Investment 2017 Investment 2017 Start-up/Ramp-up (1) (1) Opportunities Decisions Sales Growth 12-month portfolio Contribution € € € 2.1bn 2.6bn 190m • Continued active bidding • Long-term contracts • Abovethe €170m • Small to medium size projects • 2 take-overs forecasted • Americas 1st geography, then • ELcontracts in Asia and Americas • 19 start-ups including Europe and Asia • Acquisitions in HC and IM 1 major in AME accelerating in H2 (1) See definitions in appendix 15 February 2018 Full Year 2017 Results The world leader in gases, technologies and services for Industry and Health 27
Stable Backlog despite Major LI Start-Up in Q4 Investment Backlog(1) in €bn Increasing Investment Decisions 1000 800 600 400 200 € 0.8bn 0 Q1-17 Q2-17 Q3-17 Q4-17 In €m Yearly sales backlog(1) after full ramp-ups (1) See definitions in appendix 28 15 February 2018 Full Year 2017 Results The world leader in gases, technologies and services for Industry and Health
Starting-up Major LI Units in a Dynamic Environment 2017 2018 Q1 Q2 Q3 Q4 Sasol Fujian OCI Pemex Chinese Electronics RSA Shenyuan U.S. Mexico Project Projects China Asia 2018 forecasted additional sales > € 370m Increased bidding activity on new projects 15 February 2018 Full Year 2017 Results The world leader in gases, technologies and services for Industry and Health 29
2018 Outlook Step change in sales Deliver major LI start-ups 2017 with improved 2018 Continue to focus on growth & performance operational excellence Airgas synergies ahead Pursue business transformation; of plan leverage the Airgas model Moving forward with While investing for the future NEOS “Assuming a comparable environment, Air Liquide is confident in its ability to deliver net profit growth in 2018, calculated at constant (1) exchange rate and excluding 2017 exceptionals .” (1) exceptional non-cash items having a net positive impact on 2017 net profit 30 15 February 2018 Full Year 2017 Results The world leader in gases, technologies and services for Industry and Health

FY 2017 Appendix 15 February 2018 Full Year 2017 Results The world leader in gases, technologies and services for Industry and Health 31
Adjusted Sales Used as a Comparison Basis (1/2) F Published growth (2) E Comparable growth As of st January 1 , 2016 A B C D Published Airgas Airgas Adjusted Published 2016 (1) consolidated divestments Air Liquide 2017 2016 (1) Excluding Air Liquide Welding and Aqua Lung (2) Excluding currency, energy price fluctuation and significant M&A impacts 15 February 2018 Full Year 2017 Results The world leader in gases, technologies and services for Industry and Health 32
Adjusted Sales Used as a Comparison Basis (2/2) Published 2016 Published 2016 Air Liquide sales excluding Air Liquide Welding and Aqua Lung A excluding Air Liquide (IFRS 5, discontinued operations) Welding and Aqua Lung B Airgas consolidated Published 2016 Airgas sales with divestments fully completed as of st - Airgas divestments January 1 , 2016 C Adjusted Air Liquide 2016 starting point: A + B sales D Published2017 Published 2017 Air Liquide sales E Comparablegrowth Growth between 2016 adjusted Air Liquide sales and published 2017 sales D excluding change, energy and significant M&A versus C F Publishedgrowth Growth between published 2016 Air Liquide sales, excluding Air Liquide Welding and Aqua Lung, and published 2017 Air Liquide sales D versus A 2016 comparable sales growth excluding currency, energy price fluctuation and Airgas impact 15 February 2018 Full Year 2017 Results The world leader in gases, technologies and services for Industry and Health 33
FY 2017 G&S Revenue Breakdown by Region EUROPE AMERICAS €6.8bn ASIA- PACIFIC €8.1bn €4.1bn €19,642m Industrial Merchant Large Industries Healthcare Electronics 15 February 2018 Full Year 2017 Results The world leader in gases, technologies and services for Industry and Health 34
Consolidated P&L (1) FY 2016 Basic earnings per share adjusted for the free share attribution of October 2, 2017 15 February 2018 Full Year 2017 Results The world leader in gases, technologies and services for Industry and Health 35
Operating Margin (OIR/Revenue) FY 2017 operating marginexcluding energy improved +70bps compared to adjusted FY 2016 NB: 2016 figures have been restated to account for IFRS 5, discontinued operations. 15 February 2018 Full Year 2017 Results The world leader in gases, technologies and services for Industry and Health 36
Consolidated Balance Sheet Simplified - In €m * Including fair value of derivatives 15 February 2018 Full Year 2017 Results The world leader in gases, technologies and services for Industry and Health 37
Cash Flow Statement * PPE: Property, plant and equipment. 15 February 2018 Full Year 2017 Results The world leader in gases, technologies and services for Industry and Health 38
Impact of Currency and Energy on G&S Revenue Refer to appendix for definitions 15 February 2018 Full Year 2017 Results The world leader in gases, technologies and services for Industry and Health 39
Revenue Analysis by Quarter and by Business Line Refer to appendix for definitions 15 February 2018 Full Year 2017 Results The world leader in gases, technologies and services for Industry and Health 40
Revenue Analysis by Quarter and by Geography Refer to appendix for definitions 15 February 2018 Full Year 2017 Results The world leader in gases, technologies and services for Industry and Health 41
G&S Revenue Growth by Quarter and by Impact Refer to appendix for definitions 15 February 2018 Full Year 2017 Results The world leader in gases, technologies and services for Industry and Health 42
Americas Q4 Gas & Services Sales: €1,931m INDUSTRIAL MERCHANT LARGE INDUSTRIES HEALTHCARE ELECTRONICS • IM accelerating in U.S. • Back to growth following • Dynamic South America: • Very Strong Advanced • Bulk and cylinder volumes up hurricanes Brazil and Argentina Materials • Positive pricing • High air gases and H2 • Canada: solid growth • Lower E&I sales vs. • All end-markets positive volumes high Q4 2016 • Hardgoods significantly up • Very strong growth in South America and Canada (1) (1) Refer to appendix for definitions (2) Excluding impact of energy and compared to the adjusted 2016 operating margin 15 February 2018 Full Year 2017 Results The world leader in gases, technologies and services for Industry and Health 43
Europe Q4 Gas & Services Sales: €1,748m INDUSTRIAL MERCHANT LARGE INDUSTRIES HEALTHCARE • Despite 1 less working day, • Decline as expected due to high • Solid Healthcare positive Q4 growth comparison effect – customer • Lower M&A, tariff pressure • Broad-based strength,especially indemnity • Medical gases impacted by 1 less Eastern Europe • Solid H2 demand working day • Bulk and cylinder volumes up • Eastern Europe impacted by • Solid Hygiene and Specialty Ingredients • All end-markets growing stoppage in Ukraine (1) (2) (1) Refer to appendix for definitions (2) Excluding impact of energy 15 February 2018 Full Year 2017 Results The world leader in gases, technologies and services for Industry and Health 44
Asia-Pacific Q4 Gas & Services Sales: €1,039m INDUSTRIAL MERCHANT LARGE INDUSTRIES ELECTRONICS • China again >+15% with very • Several ramp-ups in China • Double digit growth (China, strong growth both in cylinders • High air gas volumes in Korea, Japan, Singapore) and bulk Singapore • Very dynamic Advanced • Strong pricing • Positive Australia Materials • Flat Australia, decreasing Japan • Strong growth in carrier gases • High level of E&I sales (1) (2) (1) Refer to appendix for definitions (2) Excluding impact of energy 15 February 2018 Full Year 2017 Results The world leader in gases, technologies and services for Industry and Health 45
Industrial Merchant Pricing Refer to appendix for definitions 15 February 2018 Full Year 2017 Results The world leader in gases, technologies and services for Industry and Health 46
Investment Cycle – Definitions ●Investment opportunities at end of the period – Investment opportunities under consideration by the Group for decision within 12 months. – Industrial projects with investment value > €5m for Large Industries and > €3m for other business lines. – Includes asset replacements or efficiency projects. Excludes maintenance and safety. ●Investment backlog at end of the period – Cumulated industrial investment value of projects decided but not yet started. – Industrial projects with value > €10m, including asset replacements or efficiency projects, excluding maintenance and safety. ●Sales backlog – Cumulated expected sales per year generated by the current investment backlog after full ramp-up. ●Decisions of the period – Cumulated value of industrial and financial investment decisions. – Industrial, growth and non-growth projects including asset replacements, efficiency, maintenance and safety. – Financial decisions (acquisitions). 15 February 2018 Full Year 2017 Results The world leader in gases, technologies and services for Industry and Health 47
Gas & Services Industrial Capex by Geography G&S FY 2017 capex(1) G&S capex(1) / sales €1.9bn (1) Gross industrial investments. 15 February 2018 Full Year 2017 Results The world leader in gases, technologies and services for Industry and Health 48
Financing Structure As of December 31, 2017 (1) Others: Finance leases and put options granted to minority shareholders. 15 February 2018 Full Year 2017 Results The world leader in gases, technologies and services for Industry and Health 49
Regular and Sustained Performance Revenue(in €m) (1) 21 000 +6.0% EPS (in €) +7.5% 18 000 CAGR(2) 5,0 CAGR(2) 15 000 over 30 years over 30 years 4,0 12 000 3,0 9 000 6 000 2,0 3 000 1,0 0 0,0 1987 1989 1991 1993 1995 1997 1999 2001 2003 2005 2007 2009 2011 2013 2015 2017 1987 1989 1991 1993 1995 1997 1999 2001 2003 2005 2007 2009 2011 2013 2015 2017 (1) Cashflow(in €m) +6.9% 3,0 Dividend (in € per share) +8.6% 4 500 4 000 CAGR(2) 2,5 CAGR(2) 3 500 over 30 years over 30 years 3 000 2,0 2 500 1,5 2 000 1 500 1,0 1 000 0,5 500 0 0,0 1987 1989 1991 1993 1995 1997 1999 2001 2003 2005 2007 2009 2011 2013 2015 2017 1987 1989 1991 1993 1995 1997 1999 2001 2003 2005 2007 2009 2011 2013 2015 2017 (1) Adjusted for the 2-for-1 share split in 2007, for attributions of free shares and for a factor of 0.974 reflecting the value of the rights of the capital increase completed in October 2016. (2) Calculated according to prevailing accounting rules over 30 years. 50 15 February 2018 Full Year 2017 Results The world leader in gases, technologies and services for Industry and Health
For further information, please contact: Investor Relations Communication Aude Rodriguez + 33 (0)1 40 62 57 08 Anne Bardot + 33 (0)1 40 62 50 93 Louis Laffont + 33 (0)1 40 62 57 18 Annie Fournier + 33 (0)1 40 62 51 31 Ludmilla Binet + 33 (0)1 40 62 57 37 Jérôme Zaman + 33 (0)1 40 62 59 38 Joseph Marczely + 1 610 263 8277 www.airliquide.com Follow us on Twitter @AirLiquideGroup Corporate Headquarters: 75, Quai d’Orsay L’Air Liquide S.A. 75321 Paris Cedex 07 Corporation for the study and application of processes developed by Georges Claude Tel : +33 (0)1 40 62 55 55 with registered capital of 2,356,439,277.50 euros RCS Paris 552 096 281 15 February 2018 Full Year 2017 Results 51 The world leader in gases, technologies and services for Industry and Health